
Three Questions to Ensure Continuous Improvement of Your Incident Reduction Strategy
An observation program is a critical process that will provide the data to identify what and where risks are occurring.
- By Grace Herrera
- Jul 01, 2018
Every OH&S professional aims to reduce incidents and injuries, but is their strategy as efficient and effective as it could be? Continuous improvement is vital in keeping your processes and programs relevant toward achieving your goals. In an effort to maintain an effective safety process on your quest to reducing incidents and injuries, ask yourself these three questions:
- What are our biggest risks?
- What processes do we have in place to help minimize/eliminate these risks?
- Are these procedures, processes, and programs actually being utilized/implemented by our team, and are they effective?
What are our biggest risks? These can be identified by reading through observation data, incident investigation data, near miss reports, and the already known high-hazard work done by your teams.
What processes do we have in place to help minimize/eliminate these risks? These can be a combination of standard operating procedures, job hazard analysis, observation process, training programs, etc. Note: Not all processes are safety department-specific. Some of these include hiring practices, management practices, etc.
Are these procedures, processes and programs actually being utilized/implemented by our team, and are they effective? Reviewing the utilization and effectiveness can be done in a number of ways, to include observing the work being performed and comparing it to your standard operating procedures and reviewing your results periodically in an effort to correlate the impact your processes and training programs have on your losses.
Identify the Risks
Lagging indicators are data points that are considered to be reactive to an occurrence, versus leading indicators that allow opportunities to implement proactive strategies to prevent occurrences. Both can provide the data points to help identify the gaps within your processes and programs. An example of a lagging indicator is your incident data. Reviewing the incident data should provide insight into what process/programs unsuccessfully provided the information necessary to perform the task safely and/or where the team unsuccessfully followed the process/program. An example of a leading indicator is your observation process. The purpose of the observation process is to identify risky behaviors and conditions and intervene to prevent incidents. Observation data details such as project, contractor, category, and comments will provide the information you will need to answer the three questions above.
Observation Data—At Risk Behaviors and Conditions
An observation program is a critical process that will provide the data to identify what and where risks are occurring. Observation data points are snapshots in time of the behaviors and conditions at a specific project. These are your leading indicators, also known as precursors to an incident. Utilizing the observation data points to track and trend at-risk behaviors and conditions is a great practice to pinpoint where you should focus your efforts and resources to reduce your incidents.
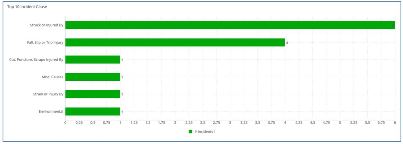
The trends will identify areas of your work that need a review of processes and procedures and possible needs for training. Depending on how the observation process is structured, the data points can help not only determine what type of work is being performed, but also identify which crew is taking these specific risks. Charts below are examples of at-risk observations by sub-category and crew/subcontractor (company).


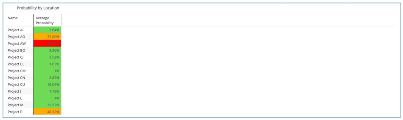
Take it one step further by trending the total number of observations and comparing them to the number of at-risk observations. Over time, these data points will define if the project is observing behaviors and conditions in a consistent manner. You can use these metrics to define a probability model for your projects. Probability models are effective in prompting a review of data points for those specific locations with higher percentages. The example below is a result by project illustrating the percent of probability the location has of sustaining an incident.
Incident Investigation—Root Cause Analysis Results
Incident root cause analysis results provide the details of the incident, as well as the root cause of each failure within the process or procedure. These are your lagging indicators. A review of the process and procedure, as well as the program for training for the tasks being performed during the incident, is a good practice to ensure every step is addressed accordingly.
It is important to communicate the means in which to perform the task safely. Tracking and trending data can help identify the recurring issues that are causing the incidents. Trending will allow you to understand the causes and update and/or design processes, job hazard analysis, etc. according to the needs of the crews.
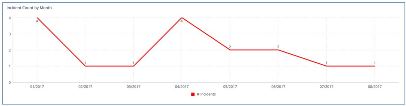
Another best practice is looking at your incident trending data and identifying when the incidents occurred over a period of time. Identify what type of work was being done at that time and what internal and external factors may have had an effect on the work. The example below shows spikes of incidents in January and April. Taking some time to go back and review the types of incidents and work during these months to determine the underlying causes will help you identify areas of your processes that may need some attention.
Periodic Reviews
Once a process/program is implemented, it is imperative to create a continuous improvement system to ensure the process and programs are as effective as originally intended. Periodic reviews of the processes should be a part of your program audit as systems, materials, and teams evolve.
For example, an audit of safety processes and programs at each project or sample of projects by division annually will help determine what works for your teams and what needs updating to accommodate for new materials, equipment, processes, etc. These reviews should be conducted by higher-level personnel within the organization who understand the purpose of the process and programs. Use these change leaders to provide constructive feedback and drive buy-in for those areas within the organization that struggle to adopt the process.
Share the Results
Communicating the improvements and updates to current processes sends a message that nothing is perfect and set in stone. As the industry and internal team evolve, your processes will evolve along with them. Transparency provides credibility to your process and programs. When your crews see changes and resources allocated, they will begin to understand the purpose of the observation process. With time, they may even begin to appreciate the steps the OH&S team is taking to provide a safer, more efficient work environment.
Your safety culture will shift from being viewed as a "gotcha" program to more of a "how can I help you" program. Establishing this credibility generates trust between the crews and the OH&S team, which in turn generates employee participation.
As OH&S professionals, we work hard every day to ensure our project teams create a safe work environment for all crews. These project teams rely on the processes and programs created by management to protect all those who are working on the projects. Keeping these processes and programs updated will ensure the teams have the resources necessary to perform the task in the safest manner possible. These three questions will provide the information necessary to identify any gaps and/or areas of your work that have evolved, as well as allow you the opportunity to take action to improve your processes before someone gets hurt.
As our workforce, materials, and systems evolve, so must our processes to ensure all go home safely to their families every night. It is not a matter of being perfect; it is a matter of saving lives and keeping people safe.
This article originally appeared in the July 2018 issue of Occupational Health & Safety.