
A Tool for Real-Time Analysis
By obtaining rapid information in a visual display, the decision maker can make informed decisions based on accurate, fast analytical results.
- By John P. Higgins
- Dec 01, 2009
Imagine you're a decision maker at an emergency operations center, and an event just occurred. This event could be a hurricane, earthquake, flood, or terrorist attack. How should you respond in a dynamic situation? Where are your assets? What's going to happen next?
This was the situation in 2005, during the aftermath of Hurricane Katrina, when a detailed coastal assessment was made and used to brief state and federal personnel. Two employees of our company traveled to the state Emergency Operations Center in Jackson, Miss., to provide on-site support. The software they used, then in its infant state, generated before and after damage assessments and provided a common basemap to host resident and field-collected data.
Shortly after "The Federal Response To Hurricane Katrina Lessons Learned" was published, we were involved in several key joint experiments and exercises, providing geospatial and modeling and simulation support at US Joint Forces Command in Suffolk, Va.
Harnessing Information for Fast Decisions
Because the outcome of the event is dynamic and information is constantly being updated, not every scenario is covered in a three-ring binder. The amount and quality of the information received can lead to miscalculation and human error. For example, a chemical tanker overturns, releasing all of its contents. The tanker contains chlorine; with prevailing winds from the southwest, the chemical plume quickly migrates. The software will be used to calculate an alternate route that will avoid and navigate around the affected area, and this will be done in seconds rather than hours.
City officials have evacuated a 900-meter perimeter surrounding the spill so there is no risk of exposing the general population to lethal concentrations of chlorine gas. A high school has been designated as a meeting point/pickup site for surrounding schools. The mayor has requested additional EMS support to the evacuation site. The following steps will demonstrate how to determine the best alternate route for ambulatory and fire/rescue personnel to get to the site.
A map shown in Photo 1 contains the current situation. The hazard plume highlights the current predicted trend of the chlorine gas during a 12-hour timeframe. The responding fire station must take an alternate route to get to the evacuation site.
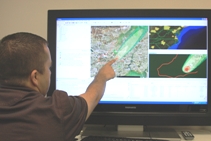
Photo 1. A manager examines the map depicting a chemical spill that has impeded the route for EMS to reach the evacuation site.
The Dynamic Route Generator allows users to create routes along roads that avoid obstacles (e.g., chemical spill, flooding, traffic congestion) or create routes along roads that are optimized for the shortest travel distance. Photo 2 shows the alternate route calculated to avoid the chemical spill.
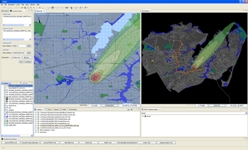
Photo 2. The alternate route is plotted for emergency responders.
The Level of Effect Tool allows users to select a source layer (e.g., flood, earthquake, chemical spill) to affect a layer of interest (e.g., critical infrastructure, Census data). The effect is based off a column from the source layer file, such as flood height, earthquake magnitude, or chemical concentration, and the level of that effect is based off the layer of interest's proximity to the source layer. Photo 3 shows a map containing the current situation, with the hazard plume highlighting the current predicted trend of the chlorine gas during a 12-hour timeframe. In this example, the chemical spill will be used as the source layer to contaminate a building footprint layer.
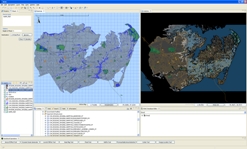
Photo 3. A 12-hour chemical spill contaminates the building footprint layer.
The result shows the building footprint will now contain a contamination level with respect to its location in the plume. The exact contamination level for each building can be found in the layer's attribute table.
Changing Course Quickly, Where It Makes Sense
Fast, accurate, and relevant information is generated and available where critical decisions must be made in dynamic environments where in every decision, a life could be at stake. By obtaining rapid information in a visual display, the decision maker can make informed decisions based on accurate, fast analytical results. This provides enough situational or battle space awareness quickly to change a course of action where it makes sense.
- Don't find out a hurricane evacuation route will be flooded and cut off when there are already people on the route trying to leave.
- Don't discover the triage center will be in the path of hazard plume after the chemical already has been released.
- If you are driving into a high-threat area, you can change your course/path/trip in a manner that helps you avoid the threat.
- If you are driving from point A to point B, you can avoid rising floodwaters, be diverted around a potential WMD incident, and identify potentially faulty bridges and dams. You can see which areas are isolated and the areas where people could be stranded or trapped.
Providing information about the extent to which an event affects critical infrastructure, key personnel, assets, and the civilian population, the software provides the tools for users from various focus areas to:
- Plan. Identify and evaluate strengths, gaps, and weaknesses in daily operations and/or infrastructure.
- Train. Solidify your response plan by "training how you operate." Returning to continuity of operations is the outcome of proper planning and mitigation.
- Operate. Manage daily operations more efficiently with a fast and highly integrate-able geospatial solution.