
Five Key Safety Metrics to Improve Performance
Pay attention to in-depth incident metrics, make adjustments to your safety practices accordingly, and you won’t have to worry as much about your TCIR rate.
- By Clare Epstein
- Sep 01, 2018
Each year, with the advancement of data collection methods and tools, more and more safety data are available to safety professionals. But when you're flooded with information, it can be challenging to decide what metrics are worth tracking.
To take some of the guesswork out of evaluating your organization's EHS performance, here are five safety data sets that deserve a closer look.
Incidents
Any seasoned EHS professional knows the importance of tracking your organization's Total Case Incident Rate (TCIR). If you're new to the safety game or just need a refresher, the TCIR is a benchmark that you can use to compare your company’s safety performance against other organizations.
To calculate this metric, start by multiplying the number of OSHA recordable injuries and illnesses occurring at your company throughout the year by 200,000. Why 200,000? This number represents the number of hours that 100 employees would work per week during a calendar year. By using this constant, you can compare incident rates on a common scale, regardless of the size of your workplace.
After you've multiplied your number of recordable incidents by 200,000, the final step is to divide this number by the total number of hours that your employees have worked. Then, you've got your TCIR.
Each year, the Bureau of Labor Statistics (BLS) publishes TCIR data broken down by industry and region, so you can take your TCIR and see how it stacks up against those of your competitors.
While it's important to keep an eye on these rates, keep in mind that this should not be the only incident metric that you’re monitoring. After all, your TCIR only gives an idea of incident frequency compared to hours worked. They don't give any possible reasons as to why the incidents are occurring!
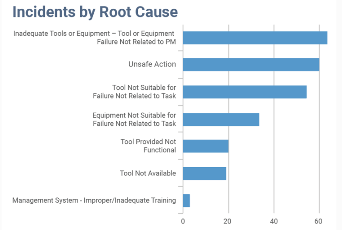
That's why you'll also want to pay attention to metrics that shed light on why incidents occur. Determining the root causes of incidents, the most common times that they occur, as well as the average time that involved employees have worked at your company can paint a more detailed picture of the factors that contribute to the occurrence of injuries and illnesses.
You can start to answer questions such as:
- Is there a shift or location that is most prone to incidents?
- What are the most often occurring types of employee injuries?
- Does an employee’s time with the company have an impact on their likelihood to become involved in incidents?
These in-depth incident metrics can set you on the path to lowering your total number of workplace injuries and illnesses. Pay attention to these metrics, make adjustments to your safety practices accordingly, and you won't have to worry as much about your TCIR rate.
Inspections
While it's important to pull as much insight as you can from incident metrics, examining only injury and illness data leaves you with just a small snapshot of your safety performance.
Inspections are your first line of defense in proactively preventing workplace injuries and illnesses. If employees aren't regularly checking their surroundings and equipment for defects or potential issues, you're practically begging for incidents to occur.
It's a simple place to start, but the first key inspection indicator you should track is the number of audits that are being completed at your location. This metric is pretty self-explanatory, but what it indicates is whether or not employees are carrying out scheduled inspections. If you have 50 forklifts used by operators each day but are seeing only 35 forklift daily inspections reported, you have a problem. In terms of compliance alone, OSHA requires a forklift inspection be performed before every operation.
Each organization will have a different number of inspections that it's looking to complete on a regular basis, but everyone will be reaching for the same goal of a 100 percent completion rate.
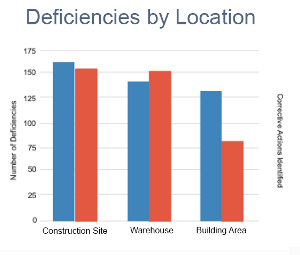
Once you've calculated how many inspections are being completed on schedule, you can start to push deeper into inspection results. One indicator that's helpful to review is which locations have identified the highest number of deficiencies. This handy metric tells you which locations have the highest percent of safety issues that will need to be addressed, and as such, which facilities might need a more in-depth evaluation.
Observations
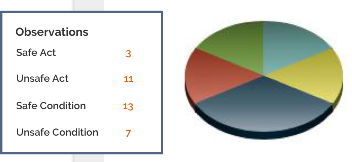
Just like conducting regular inspections of work sites, performing frequent observations of employees' safety behaviors also goes a long way toward eliminating preventable injuries.
Behavior based safety data is especially useful to monitor because it allows you to learn how workers act on a daily basis and respond to this information constructively. For example, by looking at these data, you can start to pinpoint the work procedures that would make employees safer, measure the use of safe behaviors among employees, and give positive feedback to employees who follow procedures.
You'll first want to confirm that these important reviews are being carried out by assigned workers on schedule and zero in on locations that can improve compliance. Then, by analyzing the types of unsafe acts that are observed, you can see what additional steps need to be taken, from reviewing safe lifting techniques to retraining workers on the correct use of tools, equipment, or personal protective equipment (PPE).
Training
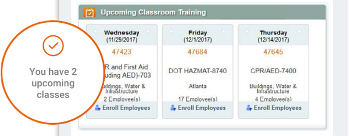
One of the simplest ways to measure the effectiveness of your training program is to pay close attention to course attendance and pass rates. You need to make sure that your employees are actually attending their required training and, perhaps more importantly, that they’re demonstrating a reasonable understanding of the material they're taught. These are the first metrics you should take a look at when evaluating your training program.
You can then go into a more in-depth analysis by determining what percent of your employees' training has expired. This will give you an idea of how many employees need to be scheduled for retraining. If this percentage gets too high, it's an indication that you're falling behind with scheduling training. If that's the case, you might want to find additional technological resources or tools to streamline your scheduling process.
You may also want to dig deeper into the specific courses that for one reason or another, too many employees are simply not attending on time. Put together a list of the top 10 courses that have the largest number of employees that are past due for training. The great advantage about this indicator is half the investigation is already done, as it tells you which classes are having an issue. All you need to do is figure out the cause and apply a fix. Even more importantly, if you see a training course on this list that is required for employees under OSHA's training standards, you can prioritize this class ahead of the others so that you can prevent a citation nightmare if a compliance officer comes knocking!
Safety Suggestions and Hazards
It's no small thing to get workers engaged in reporting close calls or unsafe conditions. If you've developed a safety culture in which employees are eager to share feedback on ways to make the workplace safer, then give yourself a big round of applause!
With that said, though, collecting this information is just the first step. Next, you'll need a way to confirm that the data are actually being reviewed and that open issues are being corrected. If an employee sees a hazard that he reported lingering in the workplace for weeks without any resolution or communication from management, this might deter him from providing input in the future.
To make sure that safety concerns and hazards are being addressed, you'll want to calculate and monitor the following metrics:
- What percentage of identified hazards have been closed this month?
- How many assigned corrective actions are coming due or are overdue this month at your location?
- What percentage of corrective actions are being completed on time?
Depending on how you're currently tracking your organization’s safety data, calculating key performance indicators may be easier said than done. If you're feeling a little overwhelmed, it may be time to re-evaluate your current safety management system. It's difficult to identify and solve critical safety issues when your tools just aren't up to the task.
One of the easiest ways to monitor safety metrics is by using a safety management software. As you improve your safety performance analysis, you'll need a system that can handle the influx of data, give you access to real-time metrics, and help you glean valuable insights hidden within the flood of information.
Utilizing a safety software will help your organization to collect data more efficiently than a manual process. One of the biggest perks of using safety software to record and analyze your safety activity is that you'll be able to quickly access your data all from one convenient source, so you won't have to go digging through multiple spreadsheets or files to find the stats you're looking for.
Finally, as you experiment, remember to think big but start small. Through trial and error, you can identify other indicators that you'll want to review. As long as you've laid the groundwork by establishing effective processes for collecting and reviewing your data, you'll be able to easily add other metrics to your analysis as your needs change.
This article originally appeared in the September 2018 issue of Occupational Health & Safety.