
Creating a Step Change in Your BBS Process Through Big Data
Many initiatives start out strong but eventually lose momentum and become the next "flavor of the month."
There has been continued progress in the field of occupational health and safety during the past several decades. Over those years, safety professionals have implemented many processes to eliminate death on the job. One such process is known as behavior-based safety (BBS). Judy Komaki and her colleagues used their behavioral techniques to improve the safety performance of a food manufacturing company by reinforcing safe behaviors (Komaki, Barwick, & Scott, 1978).
Throughout the past 37 years, the research and marketing efforts of Aubrey Daniels, Scott Geller, Tom Krause, Terry McSween, and Dan Petersen gained BBS widespread use and acceptance. However, many organizations have reached a plateau in their BBS processes and are looking to advance their safety cultures from great to world class.
A Brief Safety History of Nearly Everything
Occupational health and safety, surprisingly, has a long history and has been in existence for as long as there have been structured work environments.
Hippocrates (460-377 BC), for example, wrote of the harmful effects of an unhealthy workplace on slaves, and Caesar (100-40 BC) was reported to have an officer in charge of the safety of his legions (Pease, 1985; Weaver, 1980). As early as the 1880s, governments began influencing the health and safety of their workers through legislation such as the "Employers' Liability Act" in England, and the "OSH Act" in the United Sates was enacted in 1970.
Engineers also had a strong influence on industrial safety through the work of such pioneers as William Haddon (father of automotive safety and PPE), Lillian Gilbreth (time and motion studies), and Hywel Murrell (father of ergonomics). Even though companies have used the research and methodologies of these early safety pioneers and have a plethora of rules/regulation and policy/procedures, employees are still getting hurt.
BBS 1.0
Many companies use audits or inspections to assess the compliance with their rules, regulations, policies, and procedures. It is possible, however, to follow all of the rules and regulations and still perform risky behaviors. Thus, BBS focuses more on observable behaviors than on whether people are compliant with policies and procedures. A robust BBS process does not replace audits or inspections; it simply looks at safety from a coaching perspective. The origins of BBS stem from a sub-discipline of psychology called Applied Behavior Analysis (not from Heinrich, as is often misquoted).
Since the beginnings of BBS, many organizations have successfully implemented a process that not only engages their employees, but also provides an abundance of observation intelligence (Big Data). However, without a strong sustainability plan in place, many BBS processes enjoy a short-lived success. To continue the positive momentum or resurrect a stale one, BBS teams need to take their BBS process to the next level; they need a Safety Step Change.
The BBS Venomous Cycle
Many initiatives start out strong but eventually lose momentum and become the next "flavor of the month." Even the most successful BBS processes are at risk for complacency and can often lose their initial participation levels. This can happen for many reasons, but one of the most common is the lack of perceived value. Employees are usually quick to observe, provide feedback, and track their results. But when the observation intelligence gained from the process is not used, is misused, or is just plain ignored, the "venomous cycle" begins and a far too typical scenario follows.
Employees soon lose faith in the process when the data fails to be acted upon. As a result, the next observations completed may not be done with the same quality and the data suffers. If this continues, the employees begin to see no value in doing the paperwork and often will "pencil-whip" the observation by checking off boxes. The BBS team and leaders begin not trusting the data and may disregard the information. This lack of trust decreases the likelihood that the data will be acted upon. This venomous cycle continues until the BBS process becomes just another program that we used to do.
The BBS Virtuous Circle
Escaping the venomous cycle requires thinking differently about your BBS data. One way to sustain and improve your process is to demonstrate the value of participation. If the employees perceive their participation is influencing the safety of their co-workers, the quality will improve. If a well-intentioned employee performs an observation, provides feedback, and then has the opportunity to see his observation make a difference in the environment, process, or safety system, the next observation will have better quality.
For most of us, we need to tie a difficult behavior (observing and providing feedback) with some positive outcome for it to be repeated. This requires creating a value proposition. If your employees see the BBS process as a valuable use of their time and participation, then you will see an improvement. This requires BBS teams to assess how well they are using their observation intelligence. Strategically using the observation data can help drive the critical importance of the process to the whole organization and create a continuous learning virtuous circle.
BBS 2.0: Using Big Data to Evolve your Process
There are many factors that influence a safety culture. One effective way to improve the culture is to get the people closest to the risks to provide safety-related feedback to each other in a coaching manner and then assess the collected information to identify systems that may facilitate risky behaviors. This employee engagement is at the heart of most BBS processes.
However, even with the best implementation, many processes struggle to maintain their momentum. With all organizations asking for increases in efficiency and effectiveness, without the BBS practitioner providing a value proposition to the leadership or fellow employees, these processes begin to lose their internal support. To "upgrade" their current BBS process to a newer, more effective version, BBS teams do not need to start from the beginning, they simply need to evolve their process by using Big Data and predictive analytics.
Big Data & Predictive Analytics
Today, smartphones and tablets are widely used for everyday applications. This advantage is especially relevant to BBS processes that produce a large quantity of data. A few leaders in the industry have begun using their observation intelligence through predictive analytics. Analytics is "the science of analysis." By making full use of their BBS observations, organizations can begin using their data to tell a story about their safety cultures. Through this analysis, businesses can start taking advantage of this intelligence to predict observation quality decline, safety process deficiencies, and human error and even begin to predict where their next injury will occur.
To evolve your safety culture and make this step change in your BBS process, organizations need to first improve their observation technique by adding at-risk severity and tracking open issues; then, assess the quality of their observers; and finally, use technology to improve the predictive power of their observation intelligence.
Phase 1: Gather more "color" from your observations
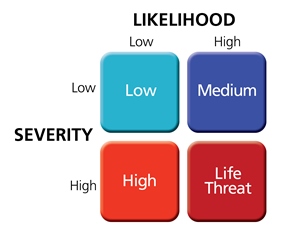 In a robust BBS process, employees observe behaviors and provide feedback. When in the observation phase, employees record as many behaviors as they see, both safe and at-risk. Comments also are recorded to clarify what was observed and to provide the person observed with specific best practices, concerns, and/or recommendations. To evolve the BBS process, observers also should track the severity of the observed risky behavior (i.e., low, medium, high, and life threat). This severity measure should be based on a simple risk matrix of severity by probability as seen in Figure 1. This criterion is essential for gathering as much "color" from the risky behaviors as possible.
Because BBS processes typically have such a high rate of safe behaviors observed and very few at-risk behaviors, it is crucial to gather as much detail about the risky behavior as one can.
Phase 2: Look at the quality of the observations
Some BBS teams have the perception that employees might "pencil-whip" their observations. This is a valid concern and speaks to a larger safety culture issue, but many never assess their observations for signs of "quality defects." This "observer quality" metric can take many forms, but it should track:
- Participation: number of observations each observer is completing in relation to other observers.
- Number Safe: number of safe behaviors per observation.
- Number At-Risk: number of at-risk behaviors per observation.
- Severity: percentage of the risky behaviors observed that are of medium severity and above.
- Comments: number of at-risk behaviors with comments per observation.
- All Safes: percent of observations with 100 percent safe behaviors observed.
Phase 3: Use Big Data to predict where your next injury will occur
Can you predict where your next injury will occur? Yes—by using your "Big Data" and predictive analytics, the organization can gain insight into its culture. Big Data is often solely associated with managing large amounts of diverse data. But more accurately, Big Data is about asking new types of questions, exploring hunches, and making data-driven decisions. Business intelligence and analytics will be a part of everyone’s jobs, if it is not already.
There is no area in organizations that could benefit more from using business intelligence than our safety departments. Today's computers, which are increasing in their capabilities and decreasing in price, are far better able to detect patterns within our safety data than humans are able to detect in the common spreadsheet. Ideally, organizations should utilize leading and lagging indicators, paired with the power of modern analytics, to help understand patterns and trends to ultimately identify where the next most likely incident could occur. When paired with more "colorful" data and better-quality observations, predictive analytics has the ability to identify where we should focus our next observations.
Once this virtuous circle is achieved, the ultimate goal of eliminating death on the job in this century is within our reach.
This article originally appeared in the October 2015 issue of Occupational Health & Safety.