
How to Interpret Data & Move up the Hierarchy of Controls
Exploring employee hazardous movement data can assist Health and Safety professionals involve substantive ‘‘upstream’’ organizational change
- By Toni-Louise Gianatti
- May 02, 2021
Work-related injuries are a complex and costly problem. Musculoskeletal Disorders (MSDs) are among the most widely spread occupational issues in industries and services, with increasing expenses of salary compensation and health costs, declining productivity and lower quality of life.
Knowing the facts and reporting past and current performance is a version of data analytics that is recognised and known as a model that works. Typically, progression towards improvement has been triggered by an injury and resulting investigation or extensive observation and subjective tools. This however can be resource intensive (time and cost) and synthetic.
The current use of wearable sensors and technologies being adopted by organizations for MSD prevention however is providing data that dives far deeper than ever before. The level of sophistication that is able to be obtained from analysing this data is gold standard and can include multi-dimensional facilitations.
Getting ahead of the injuries before they occur and reducing associated costs by using predictive analysis based on collected data is the way forward.
The most important thing, however, is for safety professionals to be able to interpret the collected data and know how to use it to make a difference. Data without context = no actionable insights.
Matthew Hart, Founder & CEO, Soter Analytics, a company specializing in developing sensors used for musculoskeletal safety says, “Data is useless until it has context and can be daunting! Our wearables collect movement risk data, it’s highly accurate, we run the algorithms and showcase it- but what we want is for it to be understood and used to its full injury prevention potential.”
Using Data to Move up the Hierarchy of Controls
Studies of workplaces have shown that the most widespread changes in favour of an ergonomic intervention involved substantive ‘‘upstream’’ organizational change to support individual behaviour change (1). Soter Analytics provide a user friendly, easily interpretable dashboard, displaying data that can be leveraged to affect the Hierarchy of Controls.
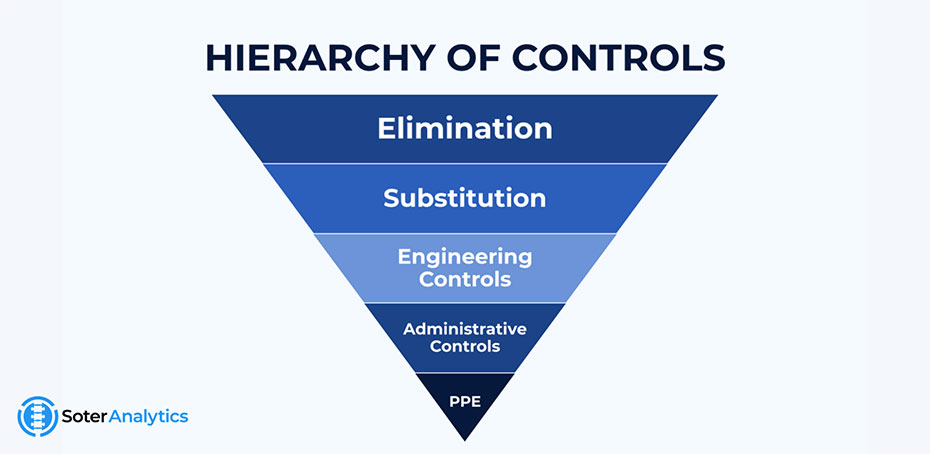
Administrative Controls
Changing the way people work
The Soter Dashboard provides organizations with the ability to track many psychosocial factors in the workplace. User reports identify safety champions as well as workers resistant to change - an informational key in the promotion of safety culture in the workplace.
The Soter wearable first and foremost delivers manual handling training using two methods; real-time biofeedback and on-the-job training modules to work through, which affects administrative controls.
Engineering Controls
Isolating the people from the hazard
Training the workers how to move safely, bringing awareness into their movements, equips them to have an informed safety conversation. The device shows them how they are moving, when, how many times, how long, evoking questions; how can I improve, how can I change this movement, what could I use to help me move better?
The workers' newly gained awareness is powerful information for health and safety professionals alongside the data to back up the peaks in hazard movement, controls can be selected to reduce the movement risk.
Substitution & Elimination
Replace the hazard or physically remove the hazard
The data further displays work and task intensity and timelines for hazard fluctuations throughout shifts or weeks, which provides data on organizational work factors to target work-rest cycles or job rotation.
Moreover, repetitive hazardous movements around common tasks may be identified and reviewed for implementation of task modification, substitution, or requirement for introduction of new tools and aids.
Data Use Case Example: Collect, Interpret, Eliminate
As a safety professional wanting to move up the Hierarchy of Controls and make improvements to the workplace, it is difficult to know where to focus your time. Understanding how to interpret collected data, and using it to guide you to reach your safety goals is easier than you think - given the right platform.
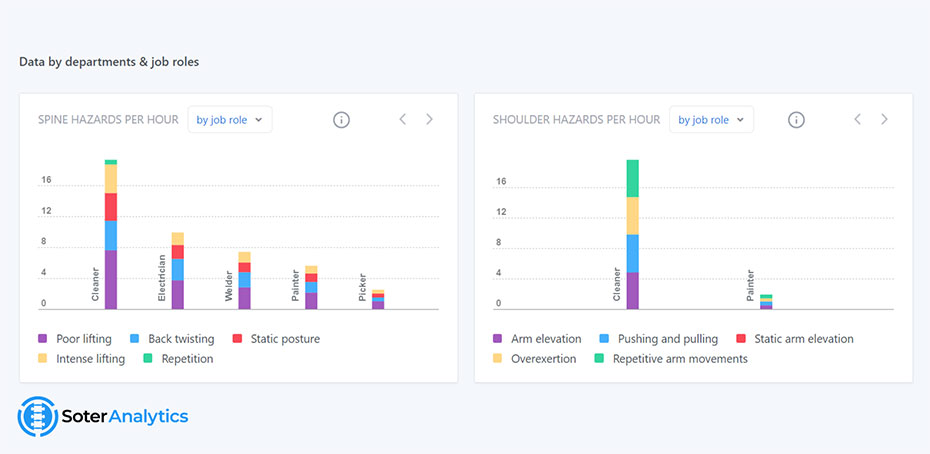
The Soter dashboard easily allows sorting/filtering of the movement data per hour by job role, task, site or department.
Using the example of data collected and shown in the graph pictured, this data has been sorted by job role. Sitting at your desk, you can quickly recognize that the ‘cleaners’ in the organization are at twice the risk of the next job role (electrician) on the graph. This instantly provides information on where to begin focusing time.
A decision can then be made to go out in the field and talk to the cleaners. Conducting observations, getting their informed feedback - remembering they have increased their awareness by wearing the device, so they're going to talk about the risks. They will also most likely discuss what is causing the device to give them notifications and about potential solutions.
If you want to move further up the pyramid and dig deeper into the task, you can bring your smart device and take a video using SoterTask - a vision recognition sensor-free AI technology. With one click, this can be uploaded for analysing, merged with existing data and ready for view once you get back to your desk.
The SoterTask technology understands all the different body parts and risk is calculated by analysing the postures and positions to obtain a baseline to what could be improved for a particular task.
Once you have implemented any controls, the same wearables and vision processing technology will provide the data to measure the difference between before and after. Where do the cleaners sit now on the graph?
This one simple example clearly shows how data can not only provide an informed starting place but also delivers an upstream approach to efficiently reach the top of the Hierarchy of Controls.
What do organizations want?
A system that is going to collect data and help the safety team move up the Hierarchy of Controls to eliminate risk. Remember, data without context = no actionable insights. Make sure the platform showcasing the data collected by any technology provides easy to understand actionable insights, with a clear upward current towards company safety goals.
Learn more about how data can provide informed safety solutions at soteranalytics.com
References
- Sultan-Taïeb, H., Parent-Lamarche, A., Gaillard, A., Stock, S., Nicolakakis, N., Hong, Q., Vezina, M., Coulibaly, Y., Vézina, N. and Berthelette, D. (2017). Economic evaluations of ergonomic interventions preventing work-related musculoskeletal disorders: a systematic review of organizational-level interventions. BMC Public Health, 17(1).
About the Author
Toni-Louise Gianatti is Head of PR & Content for Soter Analytics, a global ergonomic technology company. With a 20-year background in coaching movement and posture awareness, Toni-Louise has spent the last 4 years researching the ground-level benefits, barriers, and outcomes of using wearables and AI for frontline worker health and highlighting data visibility and industry application for workforce efficiency and safety compliance.