
Seven Ways to Improve Hand Injury Data
The real work of analyzing hand injury trends begins with the physical improvement of the organization's hand safety program after the data has been scrubbed.
- By Jennifer Choi
- Aug 01, 2018
Hand injuries account from between 40-60 percent of recordable incidents on most industrial work sites. With the average hand injury claim costing companies nearly $7,500, it makes fiscal sense to investigate ways to bring this number down on avoidable incidents.
Improving hand safety goes beyond shopping for flashy, new PPE and grinding up pages of retroactive statistics. Hand injuries impact companies beyond their profit margin. They take a toll on employee engagement and satisfaction, directly impacting productivity. Indirect costs, such as increased costs in insurance, medical bills, recruitment, training, and administrative time, add up quickly, sometimes adding another 20 percent on to the direct injury costs (Reid, 2015).
Before You Attack Technology
A combination of proactive process improvement measures and additional external regulatory forces have forced organizations to explore new technology and develop defined quality practices. With all the technological improvements now available, it is jarring to realize that many safety gloves have stagnated in design. Gloves on many sites today are cut from the same mold as your grandfather's gloves he wore to work. PPE worn on site is the last line of defense between employees and the hazards they face, but safety managers often leap past critical steps in their revision of hand safety policies for quick fixes. All too often, hand safety is reactive, post incident, or proactive, without direction. To make a real impact, we need to start our revisions before we select PPE.
Reactive and Predictive Data Tracking
Data mining and incident data tracking through algorithms have become increasingly popular. New predictive analysis software is more than just flashy. There are hundreds of software companies that are keen to get your organization on board with new formulas to boost your organization's productivity and profitability. Some of these delve into the world of safety and make big promises on reducing recordable injuries by looking for trends or patterns in the incident data. An increasing number of safety professionals use the predictive data to identify activities or times of high incidence or severity and proactively reduce the hazards through engineering controls. Used correctly, it can provide safety managers with a bird's eye view of their organization's key performance indicators, but the output is only as good as the input.
Each organization has its own prescriptive incident investigation and reporting system. The who, what, when, where, why, and how of the incidents are documented to help management uncover trends and protection gaps (Verma, Khan, & Maiti, 2014). There remains a lot of diversity in recordkeeping by safety departments, and it often differs by site or even by shift. It can get very complicated when job locations cross cultural borders in addition to geographic ones. Both factors are directly related to the level of reporting a site will see. While fatalities in developing countries are on the decline, there are reports of significant underreporting skewing the results (Geng, & Saleh, 2015). Underreporting, combined with differences in describing incidents and injuries, leaves a wake of confusion for those tasked with analyzing site data.
1. Reduce and Define Verbs
Despite defined processes in place on timely reporting of accidents and near misses, most incident reports are missing a lot of information. Many are a fill-in-the-blank style, making trend analysis virtually impossible. While it is important to collect qualitative, subjective information, it can make it difficult to get a cumulative view of the data to drive the need for corrective or preventative actions. For example, impact injuries are often listed as crush injuries, but they also can be listed as pinch, impact, or caught between. These are often mixed in with other verbs such as crush, smash, mash, and bash. Reports heavy in undefined terms have effectively scrambled effective data trend analysis. Another commonly misappropriated incident series surrounds sprain, strain, and repetitive stress. Following Balfour Beatty's landmark £500,000 fine for negligence in minimizing vibration exposure, more organizations are re-examining their prior incidents to gauge their potential risk. Because the exposure time covered nine years, the look back through fragmented data may not reveal as much as it should (Price, 2018). Benchmark organizations are creating and refining definitions for incidents and making diagrams to record areas injured, and also adding subcategories to drill down root causes further than the output injury.
2. Define Min-Max Measurements
Min-Max definitions of simple injuries can go a long way in reducing variation in reports. For example, a cut would be defined as an injury that occurred from material slicing through the skin. A cut is usually 1/2 inch or longer and is less than 69 percent of the total length of the limb/finger. An amputation could be defined as a cut that extends beyond 70 percent of the total length of the limb/finger. Conversely, a puncture is defined as a piercing of the skin from pressurized contact. The injuries from punctures are usually smaller than 1/2 inch. Cut and puncture are often used interchangeably by companies of all sizes, reducing the accuracy of the report.
Other important definitions to denote are to list the materials a person was caught between or to estimate the weight and height of an item that impacts a hand.
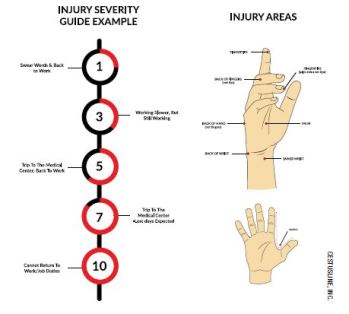
3. Identify Area of Injury: A Picture is Worth Thousands
Some of the largest organizations in the world have inconsistent reports that denote large body areas in their incident reports. If someone was injured on the hand/arm, there is not a lot of forward direction a safety manager can take from that. If the area is refined in the incident report to cover the palm, dorsal, and side areas, it is easier to identify protection gaps for future PPE improvement in the problem zones.
These areas should include a diagram. Visuals are easier for employees to identify where the injury occurred, minimizing confusion. Simple diagrams to show where on the hands an employee was injured can paint a better picture for management teams looking to take preventative actions. Make sure you identify the picture of the hand as palm or back of hand. A side view of the hand may be necessary because many injuries occur in the saddle of the hand when performing tasks with hands rotated. Zeroing in on the area injured visually can help safety management make better decisions about corrective actions and PPE selection.
4. Dig for Deeper Roots
Drilling down to the root cause may bring to mind "five whys" exercises. "Five whys" traces the incident back to a single root cause by continuing to look beyond surface reasons to an underlying cause. Its roots come from quality improvement methodologies, such as the Toyota Production System and Lean/Six Sigma (Card, 2016). Adding subcategories to root cause documentation will make it easier to identify cause in situations where a laceration is the documented recordable that required stitches with a metal hazard documented as the cause of injury. The caught between situation was undocumented as the root cause. Without multiple categories, the caught between incident will continue to recur because no corrective actions can started on something undocumented.
5. Working in Risk Assessment
There are many who believe that risk assessment should be part of the duties of everyone in the organization. Experienced safety professionals have a realistic perception of where and how near misses are likely to occur. Adding simplified risk analysis to incident reports allows the field team to communicate the likelihood of recurrence of singular incidents. Not only can this shed light on the need for preventative actions, it can engage employees to take more initiative on recognizing and voicing concerns over known hazards in their domain. Here are some questions to add:
- Has something like this happened before in this task/area? (Y/N) When was the last time it happened?
- If nothing changes, is this incident likely to recur? (Y/N)
- Rate the severity of the incident. (Develop a defined scale of 1-5.)
6. Implementing to Win in Phases
People hate change, so successful implementation must be carefully planned. Fine-tuning current reporting systems to have a limited number of add-ons is easier for teams to digest than a complete software and process overhaul. Breaking up data improvements into phases can reduce employee frustration with these additional demands over the same timeline. After a few run-throughs, team members will be more efficient with gathering and documenting this additional data. Developing a checklist can make it easier for the person doing report intake to clarify the information while it is still fresh in everyone's mind. The dividends of fine-tuning data are impactful and measurable. Suddenly, the fancy programs out in the market will compute usable reports to identify trends and hand safety program gaps.
7. Tracking Success
Luckily, fine-tuning your incident reporting process is relatively free of cost. It is one of the cheapest improvements an organization can make. The job isn't done after the initial incident reporting process refinements. The real work of analyzing hand injury trends begins with the physical improvement of the organization's hand safety program after the data has been scrubbed. The refinements help teams know where to begin by identifying high-incidence sites, tasks, injury areas, and risk factors. From this output, safety teams can make the most impactful changes now, before another recordable occurs. Developing the system will not only reduce injury experience ratios, it has the potential to improve safety engagement overall.
References
1. Card, A. J. (2016). The problem with '5 whys.' BMJ Quality & Safety, bmjqs-2016-005849. doi:10.1136/bmjqs-2016-005849
2. Geng, F., & Saleh, J. H. (2015). Challenging the emerging narrative: Critical examination of coalmining safety in china, and recommendations for tackling mining hazards. Safety Science, 75, 36-48. doi:10.1016/j.ssci.2015.01.007
3. Price, D. (2018). Balfour Beatty fined £500k over hand-arm vibration exposure. Retrieved from: https://www.constructionnews.co.uk/
4. Reid, M. (2015). Get a grip on hand injury costs. Retrieved from https://www.ishn.com/articles/101557-get-a-grip-on-hand-injury-costs
5. Verma, A., Khan, S. D., Maiti, J., & Krishna, O. B. (2014). Identifying patterns of safety related incidents in a steel plant using association rule mining of incident investigation reports. Safety Science, 70, 89-98. doi:10.1016/j.ssci.2014.05.007
This article originally appeared in the August 2018 issue of Occupational Health & Safety.