A Timeline of Safety Progress: Aligning Others and Minimizing Change Resistors
This template can help you communicate your company story throughout your organization.
Executives are often asked to summarize highlights of their safety successes and are given mere seconds to do so. Whether they have a captive audience in an elevator, directors in a boardroom, or a large group of shareholders at the annual meeting, time and attention spans are in short supply. Today, audiences are busy, overloaded with information from a pipeline rife with data. Executives struggle to find time to study even the most significant information, so there's much to gain by boiling down large amounts of data into digestible, visual increments to clearly communicate the message.
The July 2016 article "Communicating Your Safety Excellence Strategy" (OH&S magazine) outlined what needs to be communicated across a typical time horizon of 3-5 years to align others. It focused on the need to describe visually Where We Were and Where We Are, Success and Defining Safety Excellence, Strategic Priorities to Close the Gaps, and Measurements of Progress. Below, we expand on the need to communicate the history of safety and business changes, and improvements and disruptors over a longer time horizon, and provide a template for your organization to do so.
All organizations evolve in safety. While the company's story is written each day in real time with important safety outcomes, events, benchmarks, activities, and processes all occurring simultaneously throughout the organization, communicating the story is facilitated by using a linear timeline with the most important information highlighted for emphasis. Companies may choose to catalog difficult or challenging events out of respect to those who endured them or in order to preserve them as part of a noteworthy company history. As a company evolves its safety practices and performance trends, how well known is the story? Can your executives and employees tell it in a succinct manner, given only a minute or two to do so?
If change is the only true constant in business, communicating the change should run a close second. In the past two decades, companies throughout the developed world experienced a favorable trend in safety performance, yet many struggle to tell their own story. Do all levels of the organization realize what contributions led to the successes and failures of safety so far? Is the impact of past safety decisions visible to them? Can they point to times when performance changed?
Too often this information is held as intellectual property by a select few senior stakeholders in the company and, by default, it retires when they do, lost forever. This must change. To help people see the road forward, it is just as important for them to map the path up to now. The example below provides a template to communicate your company story throughout your organization.
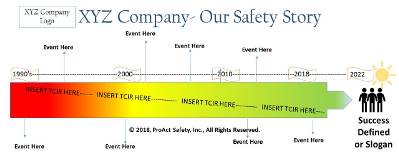
Companies measure their failure rate as a lagging indicator known by many acronyms (TRIR, TCIR, OIR). The board of directors and other key stakeholders will always be hungry to understand and improve this result because it is tied to a fundamental financial aspect of your company’s safety journey. Select a timeframe of no less than 10 years and catalog your historical failure rate inside the box. Consider using a visual gradient scale of red, yellow, and green to indicate the range of "bad to good" for additional impact.
Record the most important business benchmarks and safety indicators on the timeline. Include new product lines, facility additions, innovations in technology and safety methodology, important training events, and staff and management changes. Essentially, include anything that helps build the story. Remember, the safety journey ebbs and flows, but a good storyteller knows how to incorporate lessons learned. So choose carefully, but don’t be afraid to include the company’s bumps, bruises, and blemishes in the timeline.
Consider branding the timeline with your company's logo or safety slogan and include an inspirational quote from a valued employee that sums up the current state of safety in your company. The key is to provide the storyteller with a simple, graphic timeline to facilitate conversations about the most important story your company can tell—the Safety Story.
For a template and example to help communicate your timeline, contact the authors and reference Safety Timeline Visual.
This article originally appeared in the July 2018 issue of Occupational Health & Safety.