Modeling Aircraft Cabin Noise
Cabin design can have a big impact on noise levels during flight. Boeing wanted to predict the acoustic characteristics of a specific design during the conceptual phase.
 BOEING Commercial Airplane has used test-based methods to improve the accuracy of an acoustic aircraft cabin model that can save engineering time by predicting acoustic properties of new cabin configurations prior to physical testing. Physical testing, the traditional method for evaluating aircraft cabin acoustics, is expensive and means designs can't be finalized until well into the prototyping phase--when changes are very expensive. On the other hand, virtual prototyping using acoustic modeling tools makes it possible to quickly and inexpensively explore cabin design derivatives well in advance of the prototype phase.
Boeing uses acoustic models coupled to structural methods to predict low-frequency noise caused by engine vibration and other sources. The problem in the past was that there was no way to accurately determine the boundary conditions for the acoustic model, the amount of noise absorbed by the air, seats, and cabin surfaces, so the results could be used to predict trends but not whether a design would meet noise specifications. Experiments generated accurate boundary conditions in an aircraft cabin using a calibrated source, making it possible to calculate more accurate acoustic results using an acoustic model.
Boeing embarked on this project because the company wanted to improve its ability to predict low-frequency acoustics of aircraft cabins using finite element analysis. Finite element analysis represents the ideal tool for low-frequency acoustics because it explicitly models the entire solution domain, providing a better representation of the system dynamics.
The cabin design can have a big impact on the noise levels during flight. The objective is to be able to predict the acoustic characteristics of a specific cabin design during the conceptual phase so any needed design change can be made prior to the initial prototype. Obviously, if the design is right the first time, there is a reduction in engineering and prototyping expenses. But, in order to use finite element analysis results for optimizing the performance, weight, and cost of an aircraft, it's critical to have confidence in the accuracy of the model.
Low-Frequency Sources
The regulations on aircraft interior sound are still in the process of stabilizing. OSHA and the European Community have proposed rules that limit the amount of time a worker can be exposed to certain levels of sound. Another force that is driving sound levels down is competition to provide a quieter, more comfortable aircraft.
One of the major sources of low-frequency noise in the aft cabin of a passenger airliner is shock cell. It is caused by the interaction between the stationary disturbance field of the shock cell structure and the large-scale turbulence in the shear layers of the jet. The shock cell pulses propagate onto the fuselage and have a typical energy content at frequencies ranging from 50 to 2000 Hz. Another major source, engine vibration-related noise, is a structure-borne tone that emanates from the engine. N1 and N2, the two major engine shaft tones, are typically at 40-100 Hz and 100-200 Hz respectively, generating vibrational energy that goes through the wing and into the fuselage, which couples with cabin acoustic modes.
Because of this coupling, the entire aircraft needs to be modeled in order to understand the effects of engine vibration-related noise. The cabin design plays a critical role in the acoustic design by determining how the acoustic energy is distributed through and dissipates in the cabin. For example, cloth seats generally absorb more acoustical energy than leather seats.
Predicting cabin acoustics often requires the interaction of several different analytical models. A finite element model that focuses on rotor dynamics is used to generate the excitation for engine vibration-related noise. This model is coupled to a structural model of the entire aircraft. The propagation of noise and vibration into the cabin is predicted using a sidewall system based on Biot's theory for modeling acoustic propagation in a porous and elastic medium. This makes it possible to connect the structural model to an acoustic model. SYSNOISE from LMS International is an ideal acoustic modeling tool primarily because it simplifies the process of coupling to a structural model. One advantage is it provides a robust coupling method that does not require that the nodes of the structural and acoustic models coincide with each other. The frequencies of interest in this problem are 200 Hz and below, corresponding to a wavelength of about 2 meters, which is used to determine the density of the acoustic model.
The first step in the process is calibrating the acoustic volume velocity source. For the sake of robustness, source calibration experiments were conducted in both a reverberation chamber and an anechoic chamber, using a reciprocity measurement and direct power measurement, respectively. This calibration identified the source strength (Q) for a given driver current (I).
An acoustic model of the reverb room was constructed, replicating the source and microphone locations and source amplitude. Through iterative solutions, the optimum surface absorption is found by adjusting the surface absorption of the interior walls to match the sound pressure level (SPL) with the physical experiments. The results are curve-fitted and compare well with the room calibration data. For an additional validation, the anechoic room is modeled with a free field prediction at 2.6 meters using measured current and derived source amplitude.
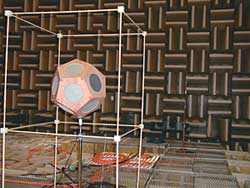
The next step was to perform an aircraft test to measure cabin acoustic transfer function. Acoustic transfer functions are calculated from the calibrated source volume velocity and seat microphone acoustic responses. A dodecahedron source was placed at a center cabin location, offset from the center of the aircraft by about one-eighth of the length of the aircraft in order to avoid a nodal line. Acoustic responses were measured with microphones located throughout the.
One microphone was placed at each seat location and a vertical array of microphones was placed at a center seat to evaluate variations from floor to ceiling. The results of the vertical array measurements show the SPL is constant from the floor to the top of the seat through 100 Hz, which is logical considering the maximum wavelength is greater than the height of seat. This finding helped to validate Boeing's approach of not incorporating the seat geometry in the acoustic model at lower frequencies. Eliminating the need to explicitly model all of the seats and cabin details substantially reduces the time required to perform the analysis.
Creating the New Model
The next step was creating an acoustic finite element model of the airplane cabin in SYSNOISE using two different mesh densities. A 50-centimeter mesh with 6,940 degrees of freedom (DOF) was used through 100 Hz and a 25-centimeter mesh with 25,490 DOF was used through 200 Hz. Lavatories and galleys were modeled as cutouts. A spherical source was located at the same point that was used in the physical tests, and field points were positioned at the same locations in the model where microphones were located in the tests.
The cabin and surface absorption were altered to achieve the best fit between the test and the finite element analysis. Acoustic transfer functions were determined between the excitation at a given cabin location and the acoustic responses at the seats, based on the experiments, and tuned the numerical model to match.
The last step was to use the model results to calculate air cabin surface absorption and effective cabin air absorption at frequencies from 50 to 200 Hz. It's important to note the derived absorption values are dependent upon the cabin configuration, which are generally airline dependent. Relative configuration items include types of carpet, seat coverings, and placement of dividers, galleys and lavatories. Thus, these results are only valid for cabins with a similar configurations; otherwise, additional testing may be required.
The test data always fall between the boundaries set by the hardwall and anechoic predictions. There is a peak at the source and rapid fall-off in the anechoic model because of the lack of reflections, while the hardwall model demonstrates strong modal behavior with multiple peaks. Similar to reverberation room calibration, the same was done for the cabin, and the derived air and surface absorption are show below.
Model Results
While a good match was achieved overall, some imperfections can be noted. The source isn't being driven loud enough at very low frequencies, which can be traced back to inaccuracies in the physical measurements used to create the calibration curves that drive the analytical model. Previously boundary conditions for the acoustic model were inferred, now validated numbers can be plugged into a finite element model for any aircraft with similar absorptive features.
The acoustic model can be used to design a new aircraft, evaluate new engines for existing aircraft, or evaluate other low-frequency noise problems. An acoustic model can be coupled to and excited by a structural model of the entire aircraft, making it possible to evaluate the effect of various options, such as moving the position of the lavatories and galleys, in much less time and at a far lower expense than would be required for physical experiments. It is also possible to obtain more complete information from the model, such as the SPL at any location in the cabin, than can normally be obtained with experimental measurements.
This article originally appeared in the July 2003 issue of Occupational Health & Safety.